Get Your Robot Logs as DataFrames with Roboto SDK
Learn how you can get your robot logs as pandas DataFrames for faster analysis!


Introduction
In robotics, analyzing log data is crucial for assessing system performance and troubleshooting issues. For instance, a systems engineer might review a robot’s trajectory to understand its behavior, while a navigation scientist might analyze motor speeds to evaluate controller performance.
However, robot logs are often stored in complex binary formats, like rosbags or parquet files, which can be hundreds of gigabytes in size. Extracting relevant slices of data can be challenging, especially when the logs contain multimodal data from different sensors or components. Engineers typically need to download the raw logs, unpack the data, and write custom scripts to extract and convert it before performing analysis in Python or MATLAB.
In this post, we demonstrate how the Roboto SDK makes it easy to get slices of your robot logs as pandas DataFrames – a widely used Python library for data analysis.
Preparation
To follow along, start by setting up your environment:
- Create a Roboto account – Sign up and configure a personal access token.
- Install the Roboto Python SDK – Follow the installation instructions.
- Install dependencies – Ensure you have the required Python packages by running:
pip install numpy matplotlib pandas
You can find the full notebook here.
Task
In this example, we will analyze a PX4 flight log to determine whether the magnetometer norm correlates with the vehicle’s thrust signal. A strong correlation could indicate that current drawn by the motors or other onboard electronics is distorting the magnetic field, potentially leading to incorrect yaw estimation - a common issue in drone operations.
Identifying such interference is a critical task for engineers working with aerial robots, as it can impact flight performance, navigation accuracy and potentially lead to a crash!
Analysis
Once a log file is uploaded to Roboto, it is processed by a corresponding action, which indexes the data and makes it accessible via the Python SDK. In this example, we’ll work with a publicly available drone flight log from the PX4 Autopilot community.
from roboto import File
file = File.from_path_and_dataset_id(
    file_path="test_flight.ulg",
    dataset_id="ds_4x7fa9o2s4q5")
This log file includes over a hundred topics, containing everything from battery temperatures to motor speeds. For this example, we’ll focus on extracting magnetometer data using the SDK’s Topic.get_data_as_df() method. This method returns a DataFrame containing the requested topic data and optionally allows filtering by start and end time.
# Fetch the `sensor_mag` topic from the log filemag_topic = file.get_topic("sensor_mag")
# Get the `x`, `y`, and `z` signals from the topic as a DataFramemag_df = mag_topic.get_data_as_df(['x', 'y', 'z'])
# Plot the data with a single commandmag_df.plot(title="Magnetometer X, Y, Z")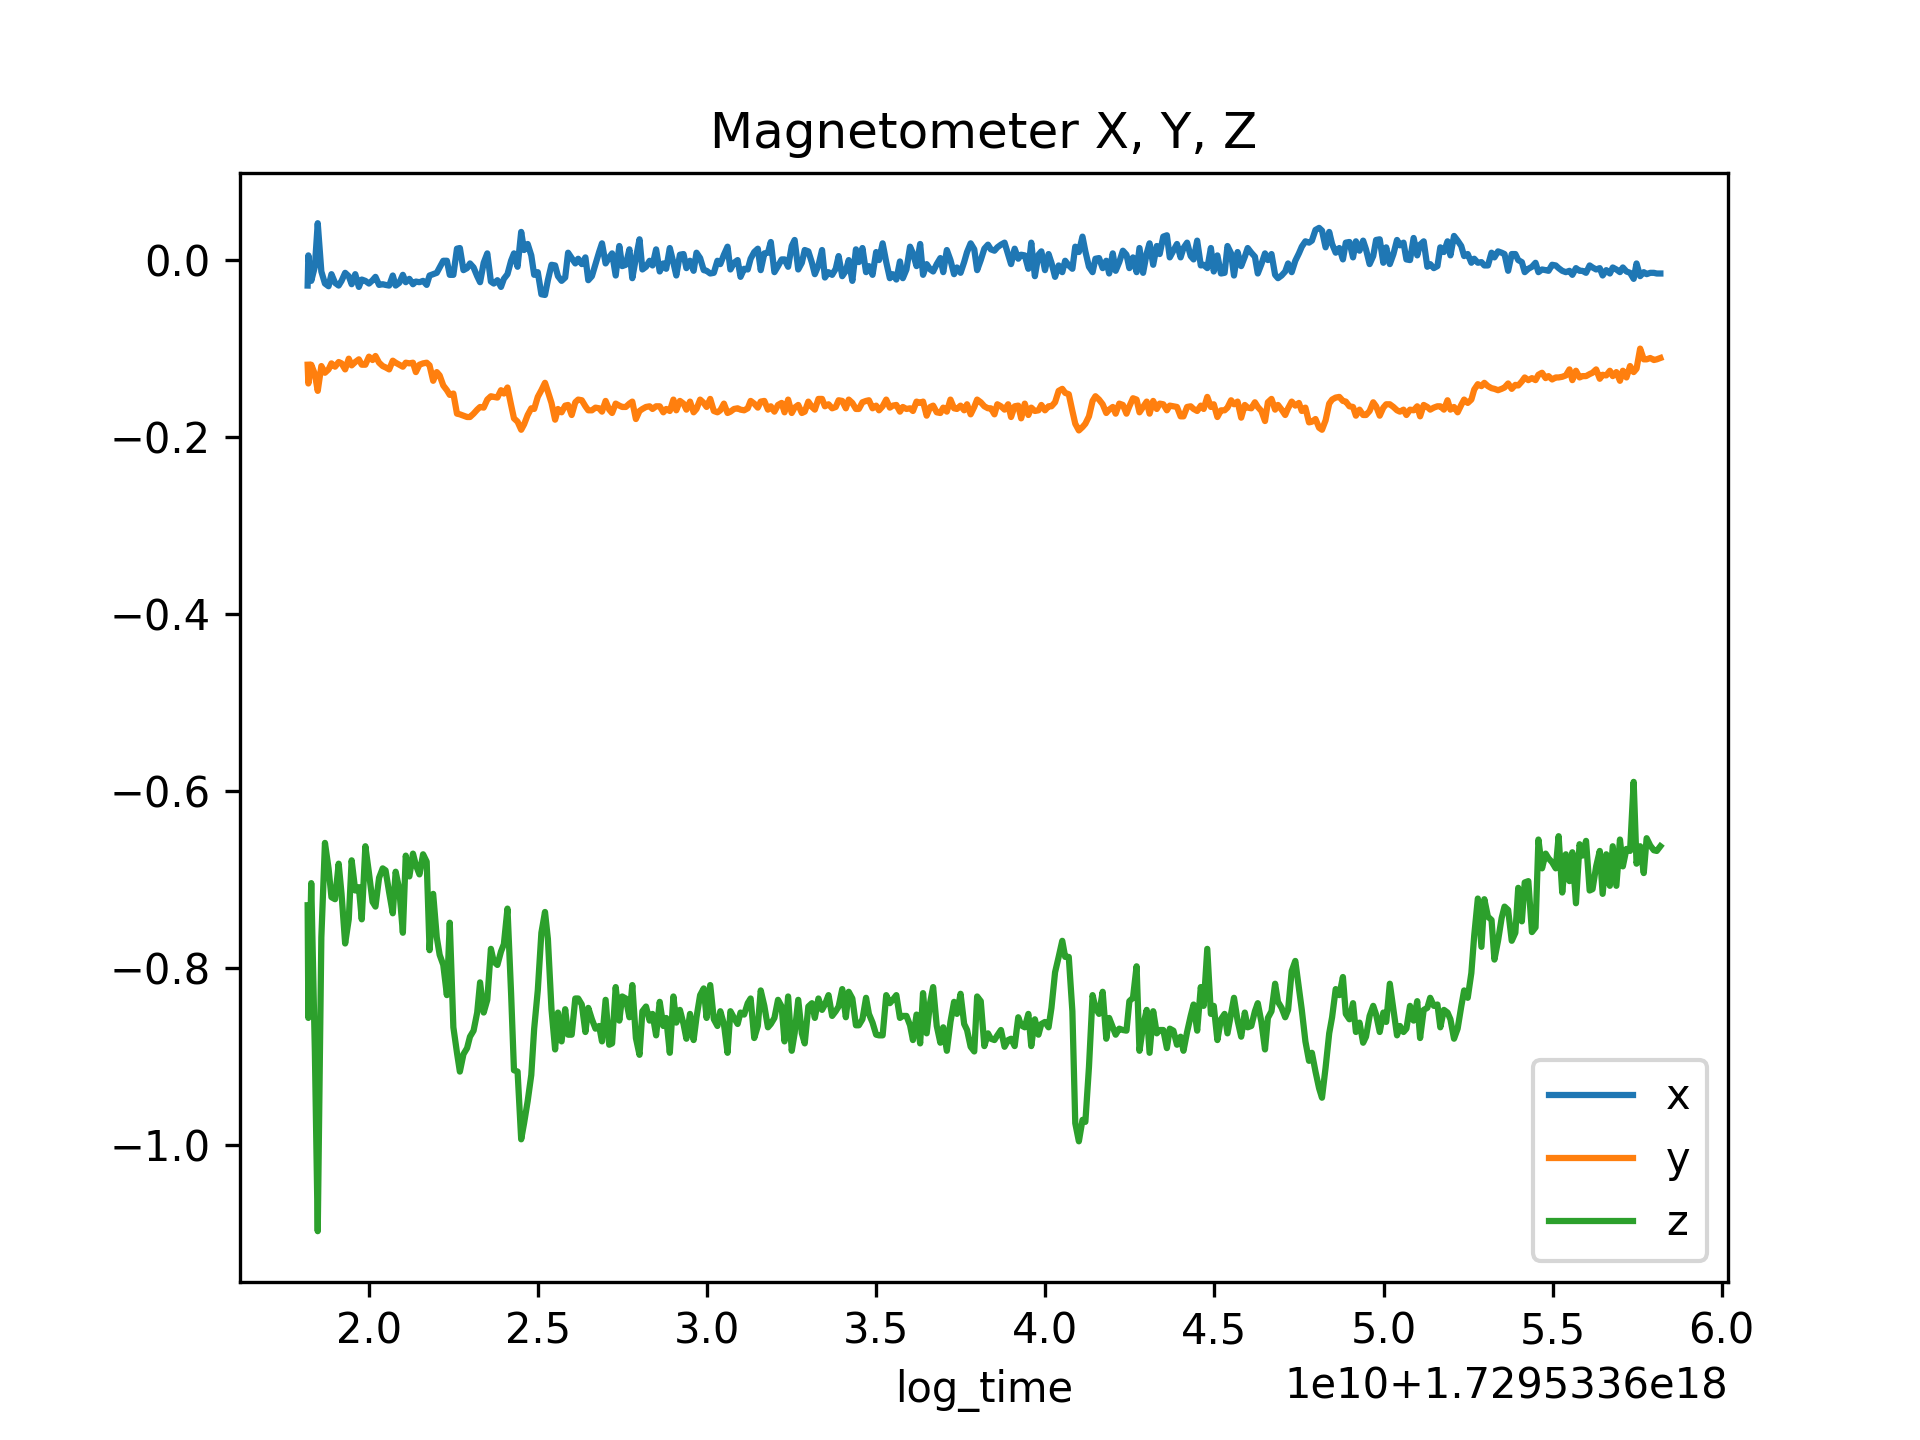
We were able to fetch and plot the specific slice of data we needed in just 3 lines! If you want to see the other fields (aka message paths) in the sensor_mag topic you can also explore the topic record:
print("Message paths in `sensor_mag` topic:")
for mp in mag_topic.message_paths:
print(f"{mp.message_path}")
We’re now going to calculate the magnetic field’s magnitude. Ideally, the norm remains relatively constant; large deviations may indicate external disturbances (e.g., flying near metal structures) or incorrect sensor readings. To assess this, we compare the standard deviation to the mean to see if the norm is stable within ±5% of its average.
mag_norm = np.sqrt(mag_df.x**2 + mag_df.y**2 + mag_df.z**2)
mean_norm = mag_norm.mean()
std_norm  = mag_norm.std()
threshold = 0.05if std_norm > (threshold * mean_norm):
print("Magnetometer norm varies more than ±5% from the mean.")
else:
print("Magnetometer norm is fairly constant within ±5% of the mean.")
mag_norm.plot(title="Magnetometer Norm")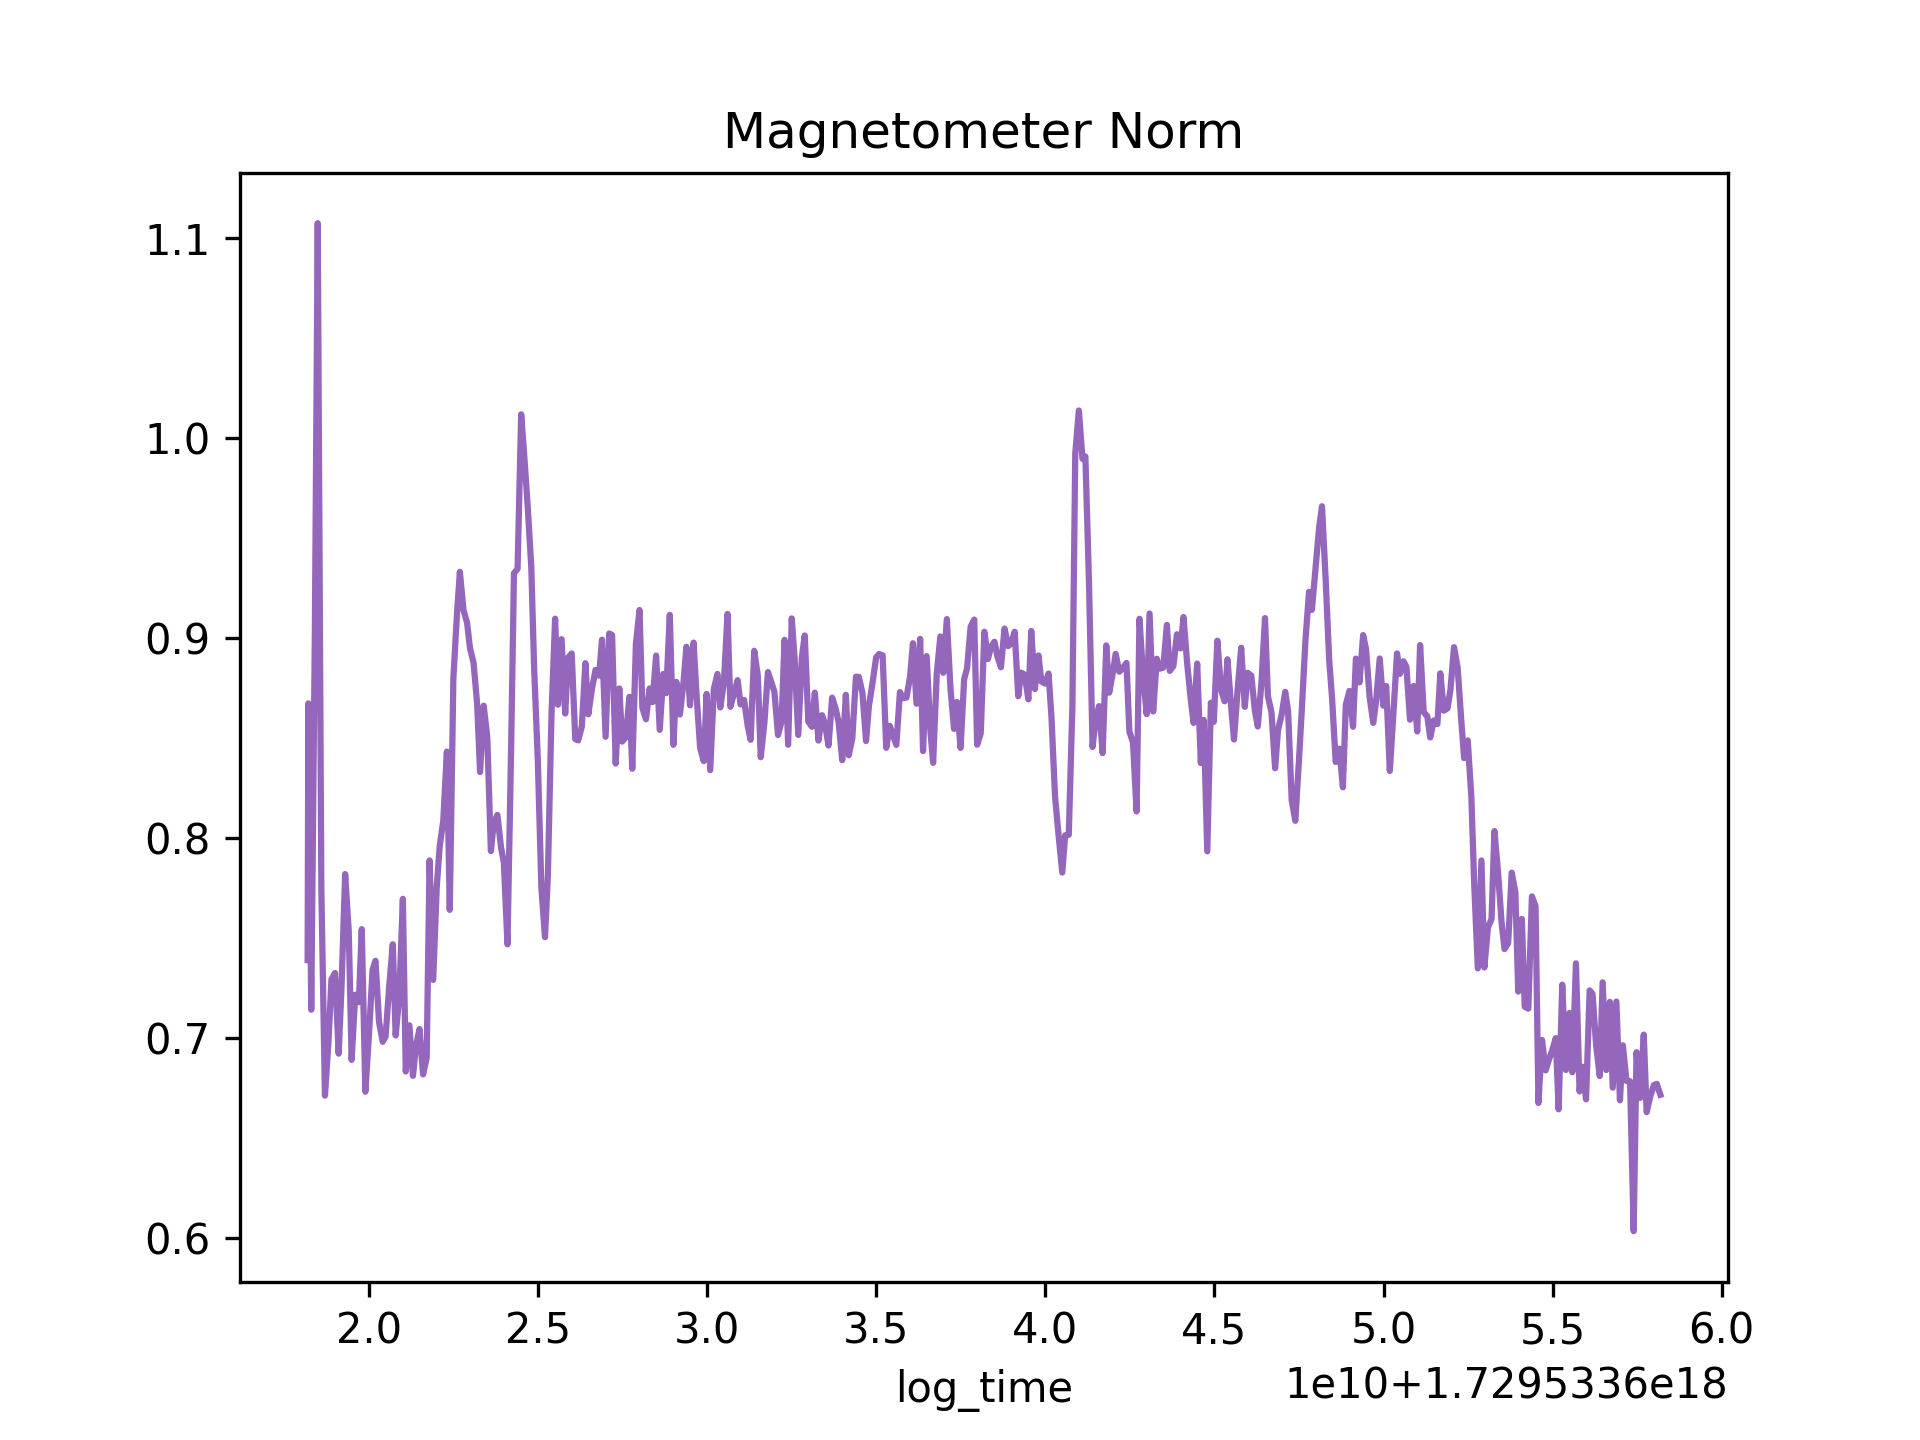
In the example above, the magnetometer norm is unstable, which may indicate a calibration issue or external disturbances, such as flying near metal structures.
Next, we’ll retrieve thrust data from the corresponding topic and compute its norm.
# Fetch the `vehicle_thrust_setpoint` topic from the log filethrust_topic = file.get_topic("vehicle_thrust_setpoint")
# Get the `xyz` signal from the topic as a DataFramethrust_df = thrust_topic.get_data_as_df(['xyz'])
# Expand `xyz` into separate x, y, z columnsthrust_df[['x', 'y', 'z']] = thrust_df['xyz'].apply(pd.Series)
# Compute thrust vector normthrust_norm = np.sqrt(thrust_df.x**2 + thrust_df.y**2 + thrust_df.z**2)
Now, we can plot the norms together to check for correlation.
fig, ax = plt.subplots()
ax.plot(mag_norm, label="Magnetometer Norm")
ax.plot(thrust_norm, label="Thrust Norm")
ax.set_title("Magnetometer vs. Thrust Norm")
ax.set_xlabel("Time (index)")
ax.set_ylabel("Norm")
ax.legend()
plt.show()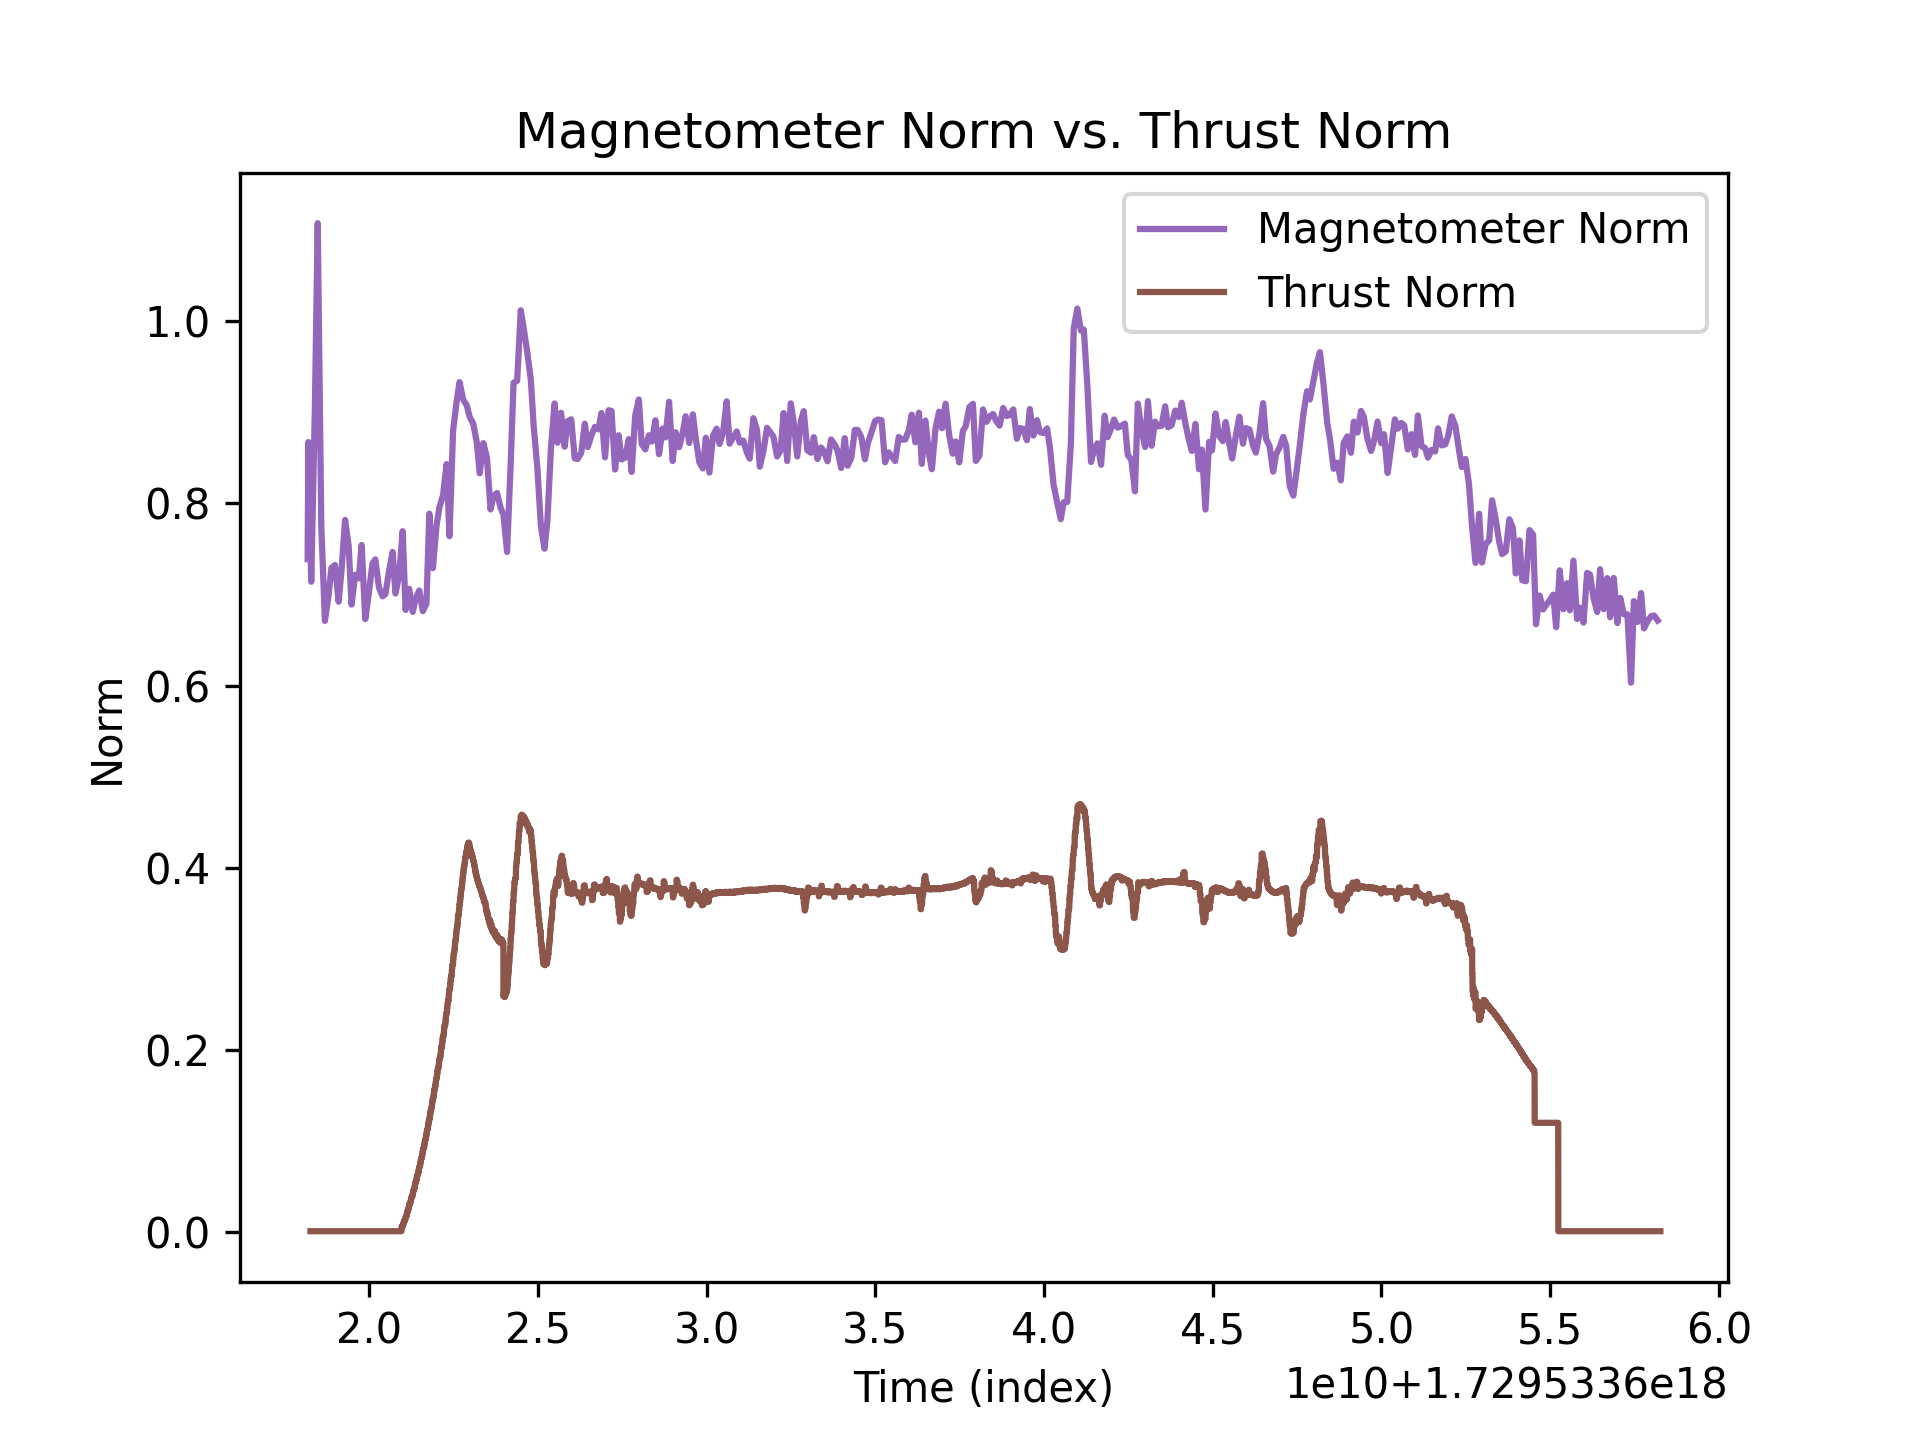
In the plot above, note the clear correlation between the norms, which can introduce yaw estimation errors and potentially lead to a crash. To mitigate this, it is recommended to place the magnetometer (and GPS) farther from power electronics, wiring, and motors on the airframe.
Next, we can explicitly calculate the correlation coefficient. The cell below computes the Pearson correlation between the magnetometer and thrust norms, first interpolating the magnetometer data to align with the thrust timestamps.
mag_norm_interp = np.interp(thrust_norm.index, mag_norm.index, mag_norm)
corr_matrix = np.corrcoef(mag_norm_interp, thrust_norm)
pearson_r = corr_matrix[0, 1]
The Pearson correlation coefficient of 0.88 indicates a strong positive relationship between thrust and the magnetic field, suggesting that changes in thrust may influence the magnetic field.
Conclusion
In this post, we demonstrated how to extract topic data from logs as pandas DataFrames and even performed some drone flight analysis. Instead of dealing with raw log data and the hassle of converting data types, Roboto provides DataFrames directly, making analysis easier. For more details on using our SDK with your own logs, check out our documentation and notebook.
References
PX4 Example Log File (Download)